![]()
![]()

Soil Moisture Dynamics in the Lower Mekong Basin
Time series of backscatter data measured by the C-band scatterometers aboard European Remote Sensing Satellites (ERS‑1&2) and the first Meteorological Operation (Metop-A) satellite were used for mapping soil moisture dynamics in the Lower Mekong Basin (LMB). Information on soil moisture variability in the LMB is valuable for many applications such as in hydrological modeling, weather forecasting, flood early warning, drought monitoring, agriculture, and climate studies.
The soil moisture data are retrieved from backscatter measurements using a change detection method developed by the Vienna University of Technology. The ERS-1&2 scatterometer data acquisitions in the Mekong river basin are available from August 1991 to January 2001 and the backscatter measurements of ASCAT, the successor of ERS-scatterometer aboard Metop satellite, are available since January 2007. High temporal sampling in all weather conditions, multi-viewing capability and availability of long-term measurements make the European C-band scatterometers excellent observation tools for soil moisture change detection.
A catchment-based analysis of the scatterometer derived soil moisture data shows strong seasonal variability of soil moisture in the LMB (Fig. 1). The wettest period across the LMB is from June to October and the driest months of the year are January to April with the lowest soil moisture in March. Fig. 2 indicates anomalies of the Basin Water Index (BWI) yearly mean during the periods of 1991-2000 and 2007-2011. Red colors mean that these areas were unusually dry, while blue colors indicate that these areas were unusually wet. The BWI anomaly maps show distinct patterns which complies with the reported extreme events in the LMB region.
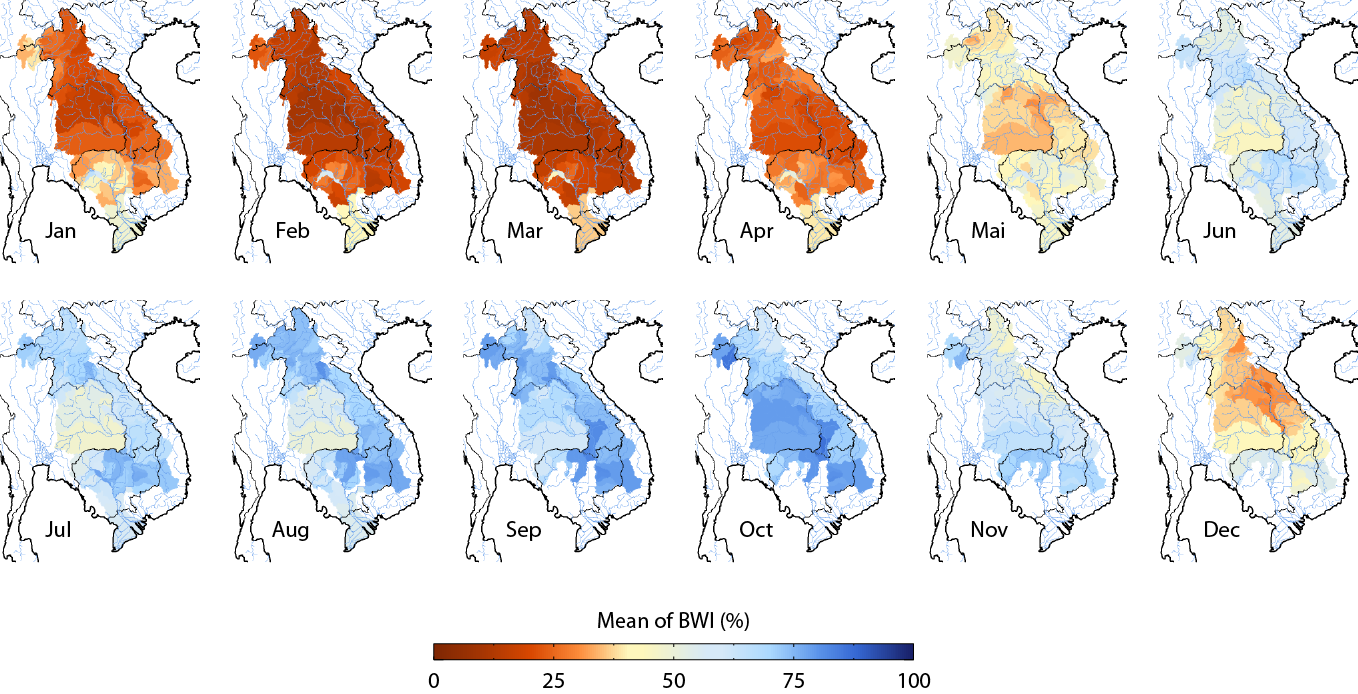
Fig. 1 Spatial maps of the monthly Basin Water Index (BWI) averaged over the periods between 1991-2000 and 2007-2011 illustrating the seasonal behavior of soil moisture in the LMB.
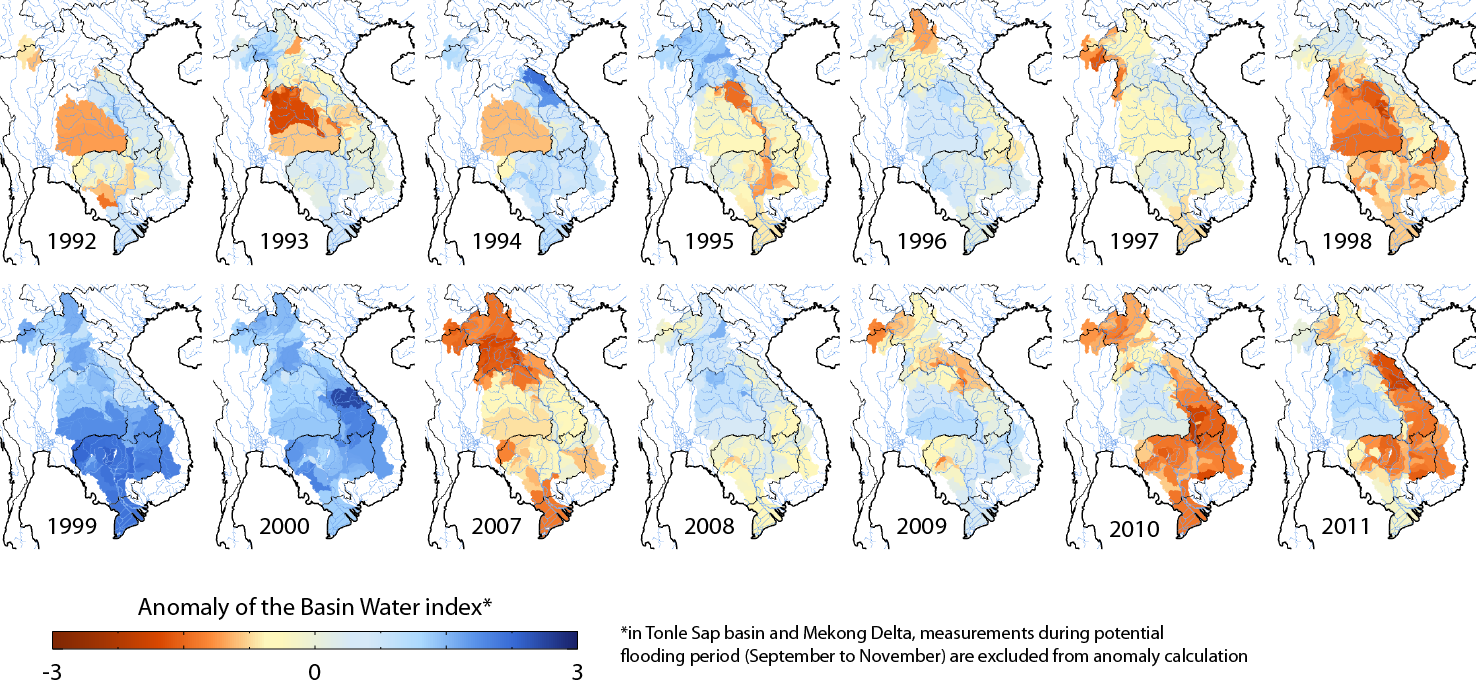
Fig. 2 Inter-annual anomalies of the BWI showing the deviation of BWI from the mean divided by standard deviation. Red colors mean that these areas were unusually dry, while blue colors indicate that these areas were unusually wet.