![]()
![]()

Maps
|
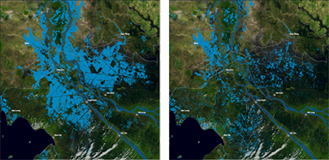
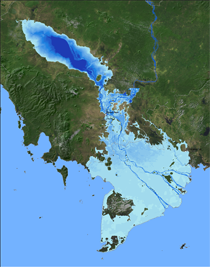
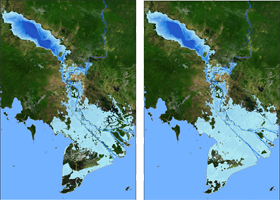
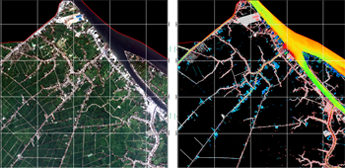
Vietnam - Mekong Delta - Seasonal Inundation The Mekong Delta is affected by seasonal flooding between July and December with its peak between late September and the end of October. The map shows the inundated areas during rainy and dry season derived from ASAR imagery using FLOODMASK software. |
 |
download (72dpi)| download (300dpi) |
|
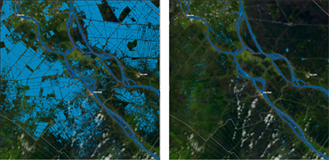
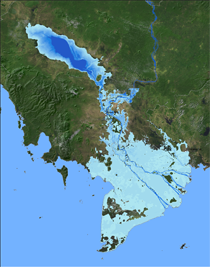
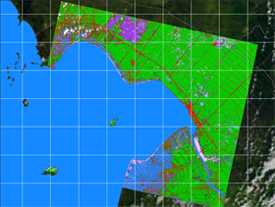
Vietnam - Mekong Delta - Seasonal Inundation The Mekong Delta is affected by seasonal flooding between July and December with its peak between late September and the end of October. The map shows the inundated areas during rainy and dry season derived from TerraSAR-X imagery using FLOODMASK software. |
 |
download (72dpi)| download (300dpi) |
|
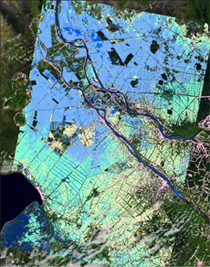
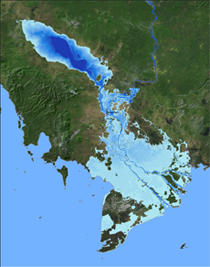
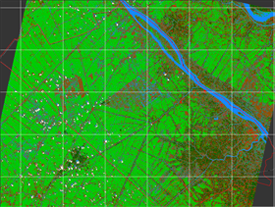
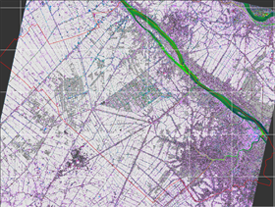
Mekong Delta - Inundation as a Function of Time 2008 The map displays the flood extension as a function of time for the year 2008. In addition built-up structures for the areas Can Tho, Rach Gia and Tam Nong are displayed. |
 |
download (72dpi)| download (300dpi) |
|
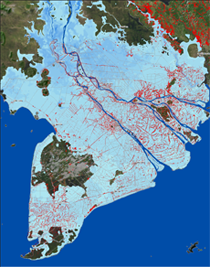
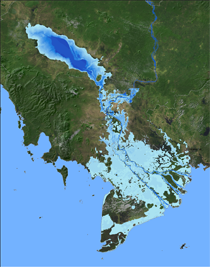
Mekong Delta - Seasonal Flooding And Sea Level Rise 2000 The map displays the flood maximum extension for the whole MK Delta. The flood year 2000 was used for the simulation under the assumption of 45cm rise of sea level. |
 |
download (72dpi)| download (300dpi) |
|
Extended Mekong Delta - Modelling of Inundation and Sea Level 2000 The map displays and compares the flood maximum extension for the whole MK Delta. Inundated areas where modeled by using a suitable method for interpolating result from a 1D hydraulic model.The flood year 2000 was used for the simulation under the assumption of 45cm rise of sea level. |
 |
download (72dpi)| download (300dpi) |
|
Extended Mekong Delta - Modelling of Inundation and Sea Level 2004 The map displays and compares the flood maximum |
 |
download (72dpi)| download (300dpi) |
|
Extended Mekong Delta - Modelling of Inundation 2000 The map displays and compares the flood maximum extension for the whole MK Delta. Inundated areas where modeled by using a suitable method for interpolating result from a 1D hydraulic model.The flood year 2000 was used for the simulation. |
 |
download (72dpi)| download (300dpi) |
|
Extended Mekong Delta - Modelling of Inundation 2004 The map displays and compares the flood maximum extension for the whole MK Delta. Inundated areas where modeled by using a suitable method for interpolating result from a 1D hydraulic model.The flood year 2004was used for the simulation. |
 |
download (72dpi)| download (300dpi) |
|
Extended Mekong Basin - Inundation Modelation 2004 (Comparison) The map displays and compares the flood maximum extension for the whole MK Delta. Inundated areas where modeled by using a suitable method for interpolating result from a 1D hydraulic model. One scenario shows inundated areas of the flood year 2004, while the other scenario simulates inundation of the flood year 2004 under the assumption of 45cm rise of sea level |
 |
download (72dpi)| download (300dpi) |
|
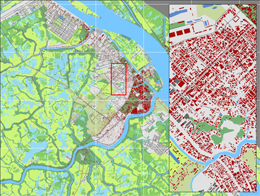
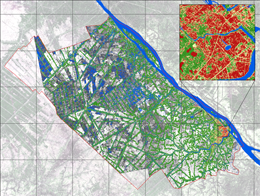
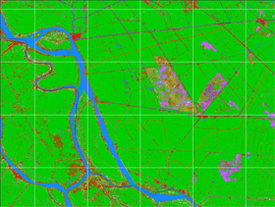
Vietnam - Can Tho City - Land Use / Land Cover 2006 Landcover/landuse classification digitized from a High Resolution QuickBird Image. |
 |
download (72dpi)| download (300dpi) |
| Vietnam - Can Tho Province - Land Cover Classification 2009 |
 |
download (72dpi)| download (300dpi) |
|
Vietnam - Can Tho Province - Turbiditiy The Map shows the spatial distribution of turbidity and suspended matter derived from Qickbird data. For data processing the Modular Inversion and Processing System was used, a processing and tool designed for the retrieval of hyrdobiological parameters from remote sensing data. |
 |
download (72dpi)| download (300dpi) |
|
Vietnam - Can Tho Province - Turbiditiy The Map shows the spatial distribution of turbidity and suspended matter derived from Qickbird data with a spatial resoluton of 2.4m. For the data and product processing the Modular Inversion and Processing System (MIP) was used, a processing and development tool designed for the retrieval of hyrdobiological parameters from multi- and hyper-spectral remote sensing data. |
 |
download (72dpi)| download (300dpi) |
| Vietnam - Can Tho Province - Land Cover Classification and Water Quality 2009 |
 |
download (72dpi)| download (300dpi) |
|
Vietnam - Can Tho Province - Imperious Surface Cover 2009 The map indicates the degree of imperviousness for settlement areas within Can Tho Province in 2009. |
 |
download (72dpi)| download (300dpi) |
|
Vietnam - Ca Mau Province - Mangrove Map 2010 The map shows different kinds of land cover classes with a special focus on mangrove species for Ca Mau Province in 2010. |
 |
download (72dpi)| download (300dpi) |
|
Vietnam - Rach Gia - Land Cover Classification 2008 |
 |
download (72dpi)| download (300dpi) |
| Vietnam - Tam Nong District - Land Cover Classification 2009
|
 |
download (72dpi)| download (300dpi) |
|
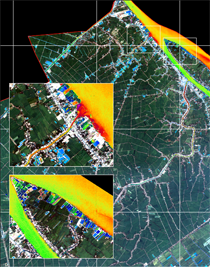
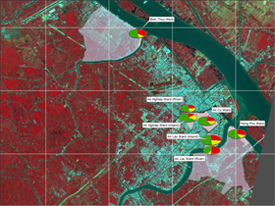
Households Affected by Regular Tidal Flooding During Rainy Season The map shows how many of the interviewed households are affected by tidal flooding during the rainy season. The red segments indicate the percentage of those households which stated that the entire house is regularly affected. Yellow indicates the flooding of parts of the house. Green indicates no flooding. |
 |
download (72dpi)| download (300dpi) |
|
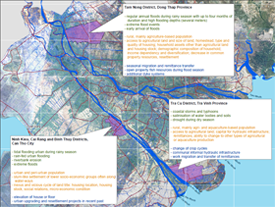
Vietnam - Mekong Delta - Case Study Areas and Main Findings Vulnerability Assessment WISDOM The map shows the Mekong Delta and the case study districts of the vulnerability assessment within the WISDOM project. |
 |
download (72dpi)| download (300dpi) |
|
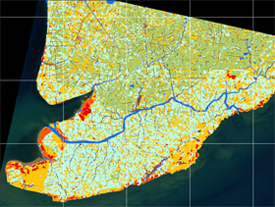
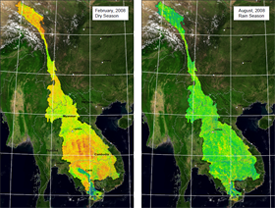
Mekong Basin - Soil Moisture 2008 Monthly mean relative surface soil moisture from Envisat ASAR Global Monitoring Mode for the Mekong River catchment. The map shows soil moisture conditions in the dry season (February) and in the wet season (August) of the year 2008. |
 |
download (72dpi)| download (300dpi) |