Water quality parameters derived from remote sensing data
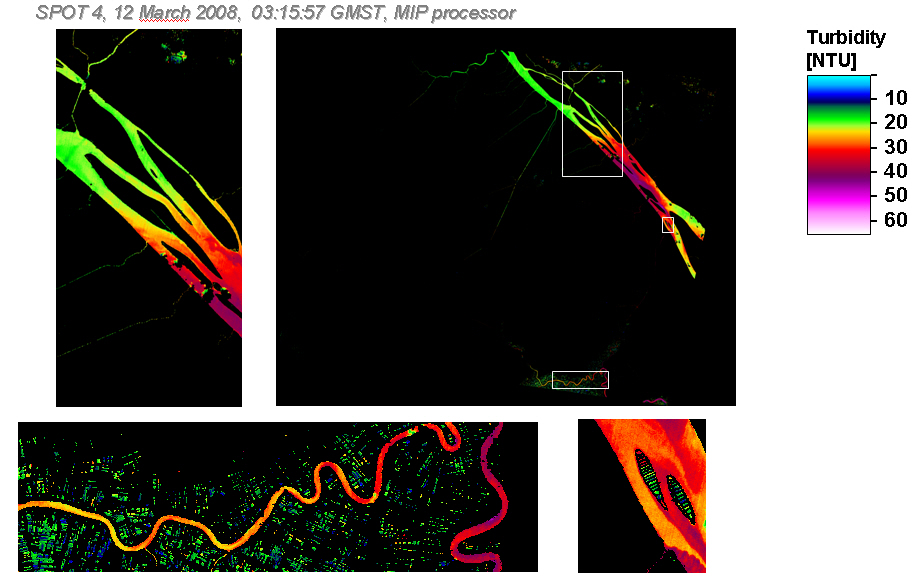
For the monitoring of water constituents in the site of investigation "Can Tho" two kinds of satellite data were used. Figure 1 shows SPOT4 satellite data (Spotimage, 2008-03-12, 03:15:57) and a map showing Total Suspended Matter (TSM) -corresponding "Turbidity"- based on the SPOT4 image. Turbidity [NTU] correlates to Particule Matter PM [mg/l]. The legend on the right side of the map describes the scaling of NTU. Start with light blue color for low Total Suspended Matter values going up to 60 NTU colored in pink.
For the monitoring of water constituents in the site of investigation "Can Tho" two kinds of satellite data were used. Figure 1 shows SPOT4 satellite data (Spotimage, 2008-03-12, 03:15:57) and a map showing Total Suspended Matter (TSM) -corresponding "Turbidity"- based on the SPOT4 image. Turbidity [NTU] correlates to Particule Matter PM [mg/l]. The legend on the right side of the map describes the scaling of NTU. Start with light blue color for low Total Suspended Matter values going up to 60 NTU colored in pink.
For the monitoring of water constituents in the site of investigation "Can Tho" two kinds of satellite data were used. Figure 1 shows SPOT4 satellite data (Spotimage, 2008-03-12, 03:15:57) and a map showing Total Suspended Matter (TSM) -corresponding "Turbidity"- based on the SPOT4 image. Turbidity [NTU] correlates to Particule Matter PM [mg/l]. The legend on the right side of the map describes the scaling of NTU. Start with light blue color for low Total Suspended Matter values going up to 60 NTU colored in pink.

Figure 1 - Turbidity in [NTU] derived from SPOT4 2008.
Method: For the data and product processing the Modular Inversion and Processing System (MIP) is used. It is a processing and development tool designed for the retrieval of hyrdobiological parameters from multi- and hyper-spectral remote sensing data. The architecture of the program consists of general and transferable algorithms based on physical inversion schemes that derive biophysical parameters from the measured radiance signal at the sensor. Inverted parameters include the variable constituents of the atmosphere, the concentration of water constituents, and the reflectance characteristics of substrates in shallow waters.
Figure 2 shows a QuickBird scene (DigitalGlobe, 2007-01-27, 03:48:19) in 2.4 meter resolution showing Basac-River, which is located at the north-west side of Can Tho. Another scaling factor for the Turbidity is used than in the SPOT4 scene. An interesting subset with more detailed information is shown on the right side.

Figure 2 - Turbidity in [NTU] derived from QuickBird 2007
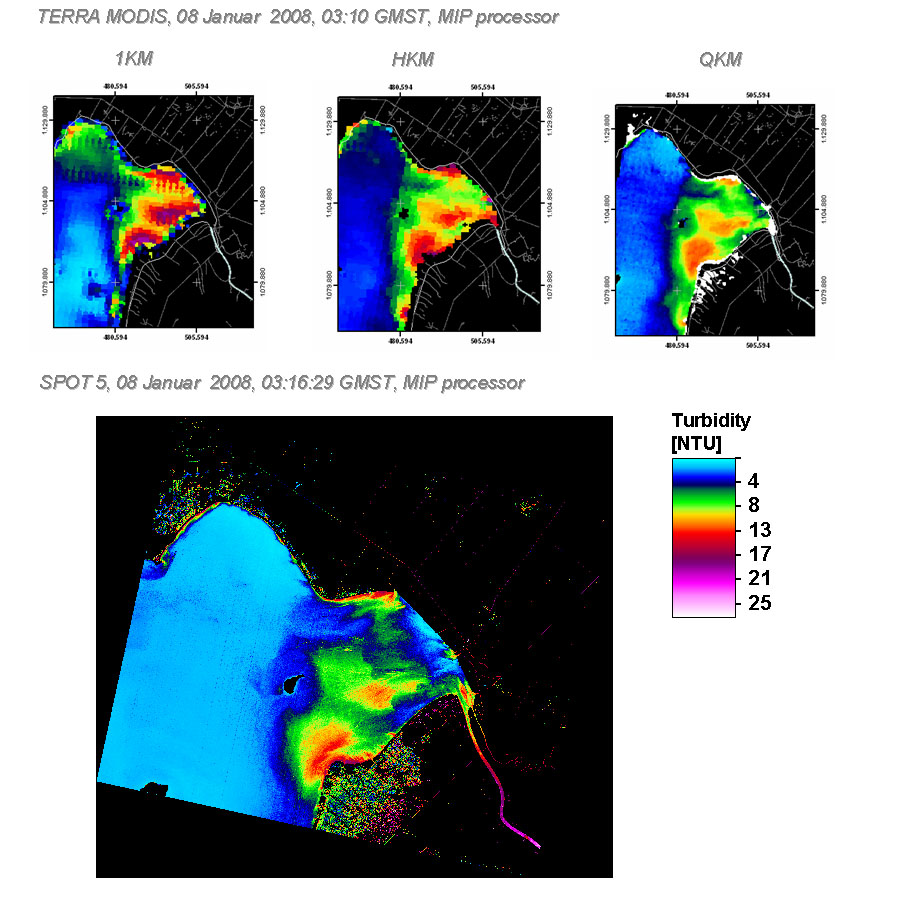
Figure 3 shows a comparison between different satellites and resolutions of MODIS (NASA, 2008-01-08, 03:10) and SPOT-data (Spotimage, 2008-01-08, 03:16:29) at the west coast of Mekong Delta. Aerosol and suspended matter are calculated for MODIS 250 meter (QKM). The retrieval of water absorbers is possible with higher spectral resolution (HKM, 1KM). The river turbidity maps deliver quantitative comparable concentrations. SPOT4 and MODIS data were recorded nearly simultaneously.

Figure 3 - Comparison TERRA MODIS and SPOT5 2008
The water quality products were produced by EOMAP for the WISDOM project. For more information please contact Dr. Thomas Heege (heege(at)eomap.de). - February 2009.


