Multi-objective automatic hydraulic model calibration
Automatic calibration of hydrodynamic models is – compared to other disciplines like e.g. hydrology – still underdeveloped. This has mainly two reasons: the lack of appropriate data and the large computational demand in terms of CPU-time. Both aspects are aggravated in large-scale applications.
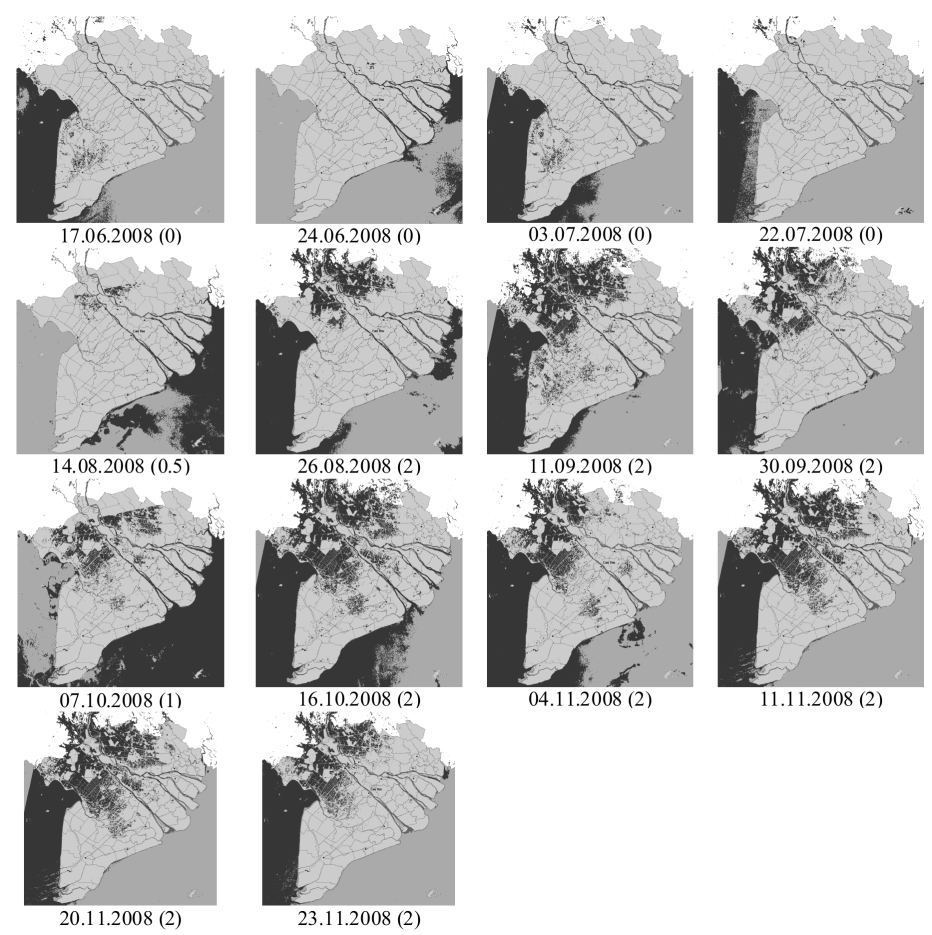
Within WISDOM, a methodology to overcome these problems has been developed and an automatic multi-objective calibration of a large-scale hydraulic model of the Mekong Delta has been achieved. The calibration uses a set of gauge data over the whole Delta and a series of ENVISAT ASAR derived inundation maps of the whole delta as objectives to be met. Fig. 1 shows the series of inundation maps.

Fig. 1: Flood extent maps derived from ASAR used for model calibration. The numbers in the brackets indicate the weights assigned for the individual map in the calibration process.
Model setup
The flood model was set up to represent the river network and floodplains in the Mekong Delta. The model domain embraces the complete Delta from Kratie including the Tonle Sap Great Lake in Cambodia to the river mouths in Vietnam. For such a large-scale model only a 1D approach is feasible from a computational point of view. However, the model needs to represent the floodplains in order to be hydraulically meaningful and to enable prediction of flood extends. The comparatively natural floodplains in Cambodia including the Tonle Sap are simulated by wide cross sections including the floodplains. The floodplains in Vietnam, which are separated into a multitude of compartments enclosed by high dikes were treated differently. Because most of the compartments represent a closed system surrounded by dikes and channels, flood cells are modelled by artificial branches with low and wide cross sections extracted directly from the DEM. Those branches are linked to the channel by control structures. Here weirs were used to represent dikes and dike overflow and sluice gates were used whenever information on existing sluice gates was present.
Multiobjective optimization
The automatic calibration of such a large-scale hydrodynamic consists of the following four elements:
- parameter classification
- multi-objective calibration algorithm
- formulation of objective functions
- parallelization scheme
Parameter classification
The roughness parameters of the model were classified into five categories: The main rivers in the Cambodian model domain (Mekong and Bassac), the main rivers (Tien and Hau rivers) and major channels in the Vietnamese part of the Delta, the floodplains in Cambodia and in Vietnam respectively due to their different characteristics, and the remaining medium and small channels in Vietnam.
Definition of objective functions
1st objective function
Using the stage hydrographs recorded at 12 stations along the main stream of the Mekong and Bassac rivers, the first objective function evaluates the temporal performance in simulating water levels in the main channels and is formulated based on the Nash-Sutcliffe model efficiency coefficient.
2nd objective function
The second objective function evaluates the spatial performance of the model in predicting inundation extent utilizing the series of ASAR derived flood extent maps.
Optimization algorithm
For the automatic calibration the Non-sorting Genetic Algorithm (NSGA) II was selected.
The master slave parallelization scheme
In order to facilitate the automatic calibration of the model a parallelization scheme for the optimization process was implemented. One node (the master) controls the optimisation routine, while the other nodes (the slaves) perform the model simulations with the different parameter sets.
Results and Discussions
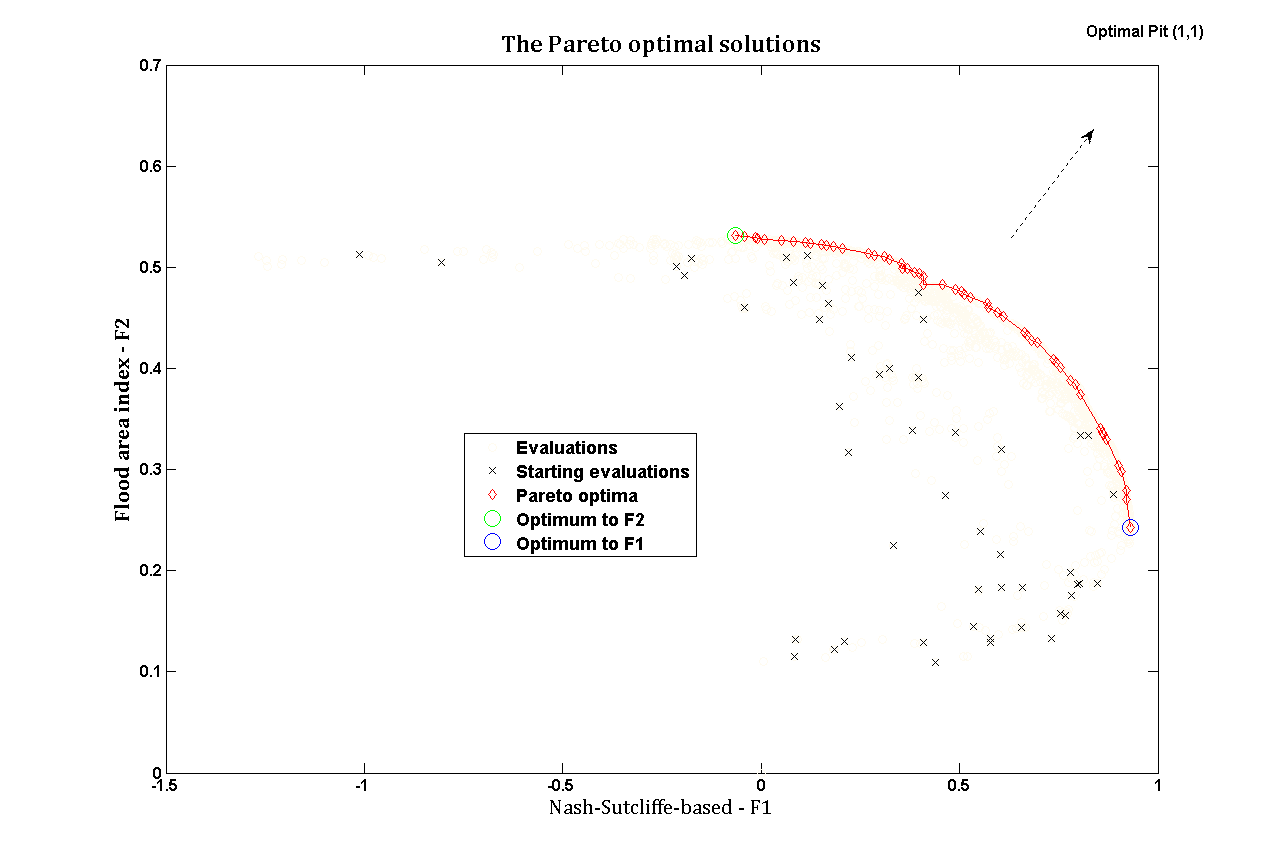
The flood model was used to simulate the flood season of 2008. A time step of 30 minutes was chosen to maintain model stability. For the optimisation algorithm iP was set to 52, the maximum iterations to 30, and hence the total number of model runs and objective function evaluations to 1560. The number of processors used was 13. The evaluation of each population took about 10 hours, i.e. the whole calibration process took about 300 hours or 12.5 days. Figure 2 shows the Pareto front of the final population, which consist of 52 Pareto-optimal solutions.
Fig. 2: Pareto-optimal solutions of the final population maximizing the objective functions.

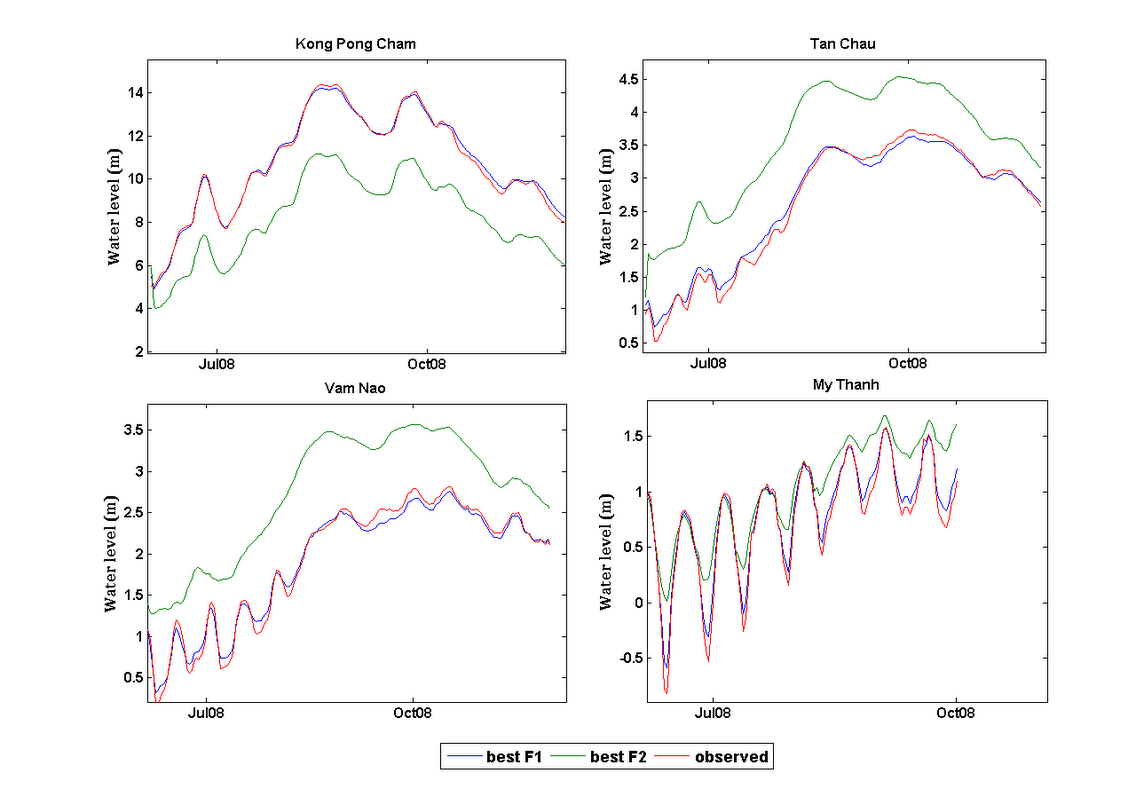
Figure 2 indicates that the objective function values for F1 and F2 exhibit a significant spread over the final population and also on the Pareto front. The best solution for either objective can only be reached in combination with a rather poor performance in the other objective, as shown in Figure 3.

Fig. 3: Observed and simulated hydrographs for best solutions for F1 and F2 for selected gauging stations.
The most likely explanation for this finding is the dike representation in the model, which has to be assumed erroneous in some parts. In order to test this hypothesis a simulation with lowered dike heights was performed. For this simulation the parameter set from the final Pareto optimal solution with the “smallest Euclidian distance” to the optmal pit (1,1) was selected.
Table 1 lists the parameter set fulfilling the criteria. This set was used simulating the inundation with dike heights generally lowered by 20%. The result in terms of model performance is also given in Table 1. Both two objectives show increased performance when lowering the dike heights by 20%. This corroborates the hypothesis that the dike representation in the model is responsible for the errors in predicting inundation extents. Further investigations on the real dike heights are therefore advised.
|
Strickler coefficient |
Objective functions |
Euclidian Distance to (1,1) |
|||||
|
Global |
Tien-Hau |
Meko-Bass |
CamFP |
VietFP |
F1 |
F2 |
|
|
20.816 |
24.808 |
34.512 |
10.000 |
14.859 |
0.745 |
0.405 |
0.647 |
|
0.759 |
0.499 |
0.556 |
|||||
Table. X: Best Euclidian distance parameter set of the final Pareto optimal population and performance values of F1 and F2 with original and lowered dike heights (-20%, in bold)
For more information on these results along with a detailed description of data and, methods please refer to:
Dung, N.V., Merz, B., Bárdossy, A., Thang, T.D., Apel, H., 2011. Multi-objective automatic calibration of hydrodynamic models utilizing inundation maps and gauge data. Hydrol. Earth Syst. Sci., 15(4): 1339-1354.


