![]()
![]()

Monitoring of floodplain processes
Part I – the instrumentation scheme
The different inundation survey systems were deployed to the field as illustrated in Figure 1.
Part I – the instrumentation scheme
The different inundation survey systems were deployed to the field as illustrated in Figure 1.
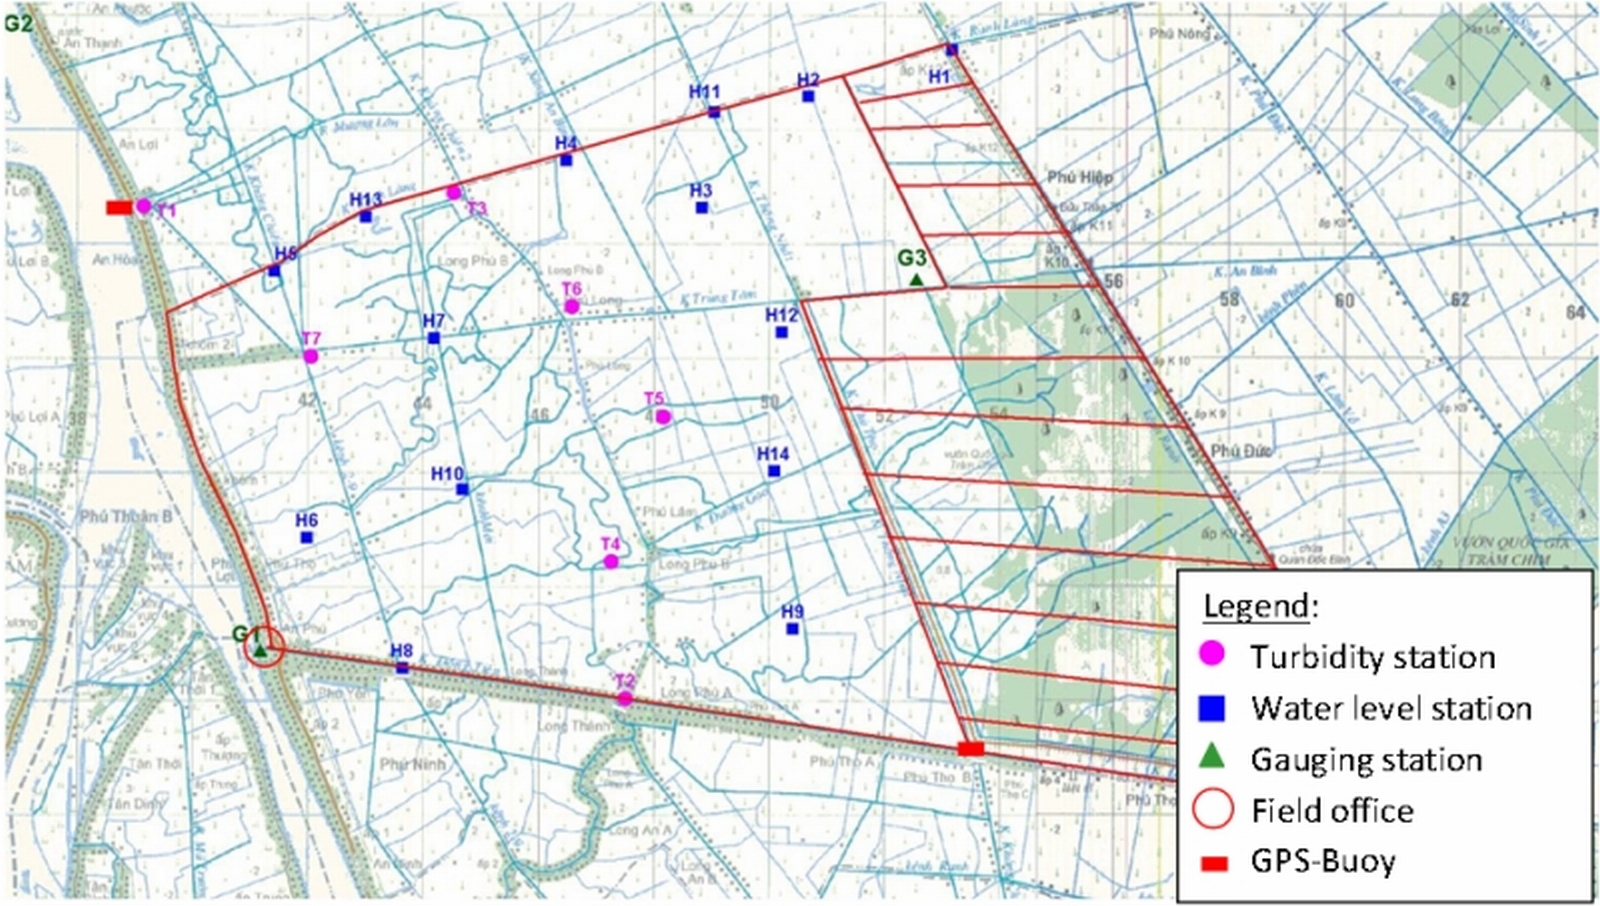
Figure 1: The investigation area Tam Nong. The figure shows the borders of the investigation area and the positions of the instruments. The hatched area indicates the Tram Chi National Park, which is completely enclosed by dikes.
The survey campaign started in July and was terminated mid-December when the floodplains were fallen dry again in most places. The deployment and operation of the systems were undertaken in close cooperation with Vietnamese project partners, i.e. SIWRR, the provincial Navigation Board, and locally hired supervisors. In the beginning some technical problems had to be solved, including the construction of an autonomous power supply for the GPS buoys and malfunctioning batteries of some turbidity stations and water level probes. However, all system were running when the flooding of the floodplains commenced, thus covering the whole flood season. Figure 2 shows the system in operation in typical settings in the investigation area.
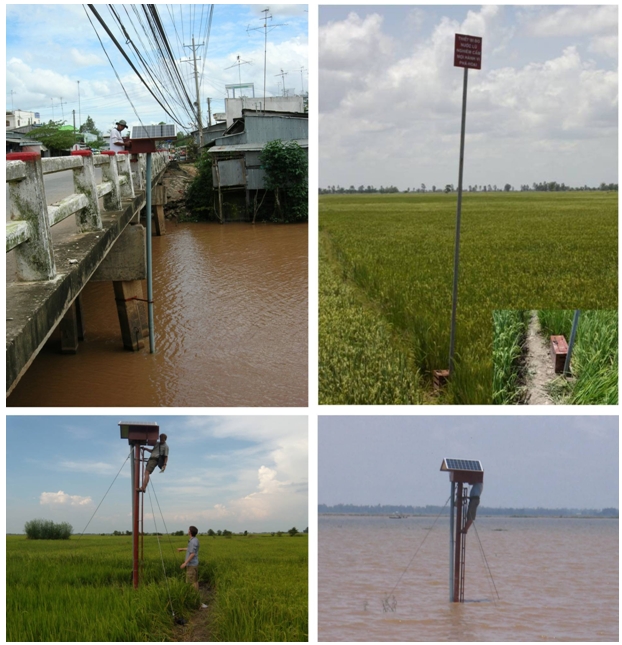
Figure 2: Flood monitoring stations in operation. 1st line: left – turbidity station at bridge (T1), right – water level probe (SEBA Dipper-II) in floodplain; 2nd line: left turbidity station in floodplain during installation, right during flood.
For the collection of total sedimentation budgets of a flood season four sediment traps were deployed in the floodplains. Figure 3 shows the design.
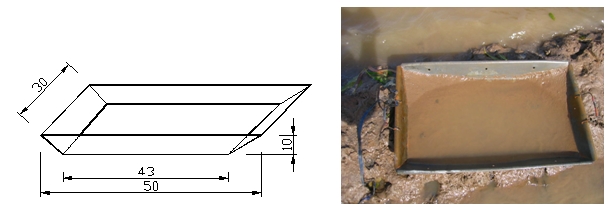
Figure 3: Dimension of the sediment traps and a recovered trap after the flood.
First results
Considering the practical difficulties and obstacles encountered in the deployment, the campaign can be regarded as quite successful. The loss of only one sensor and the partial data losses due to power supply problems can be regarded as below average compared to experiences in similar campaigns. During the campaign water samples for the calibration of the turbidity probes were collected and. The resulting linear correlation of analyzed total sediment to the SiO2-readings of the sensor was used for the indispensible calibration of the probes. Figure 4 shows uncorrected readings of the turbidity stations for a station in the floodplains and a channel exemplarily. It clearly shows the higher magnitude of suspended sediment load during the flood season in channels compared to the floodplains, as well as the reduction in turbidity in the floodplains caused by sedimentation in stagnant water on the floodplains. However, the data need to be corrected. The peaks exceeding 200 mg/l are unrealistic for suspended sediment loads and are caused by solid objects obstructing the optical sensor. E.g. in the floodplains it was observed that the sensors attracted mussels to settle on it and at time crawl over the optical unit. These errors have to be corrected in an objective way, which is part of the work in the coming months.
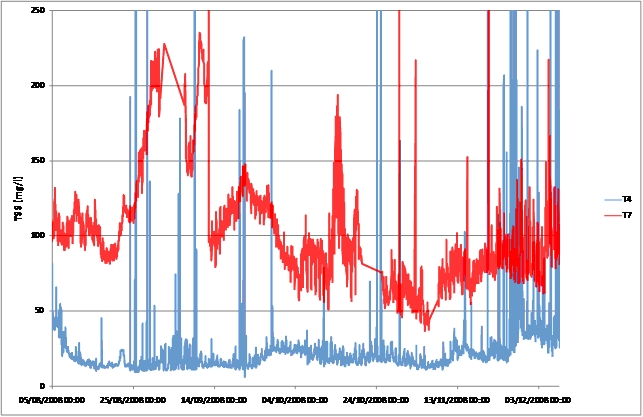
Figure 4: Calibrated but uncorrected total suspended sediment load (TSS) over the flood season for T4 (floodplain) and T7 (channel)
The turbidity readings also show the tidal influence on the flow velocities and thus the turbidity. This feature is more pronounced in the channels as in the floodplains, as one would expect, cf. Figure 5. The tidal influence in the floodplains is dampened by already almost stagnant water conditions. Additionally it is partially masked by wave action during thunderstorms. Overall, these characteristics give additional confidence in the validity of the measurements.
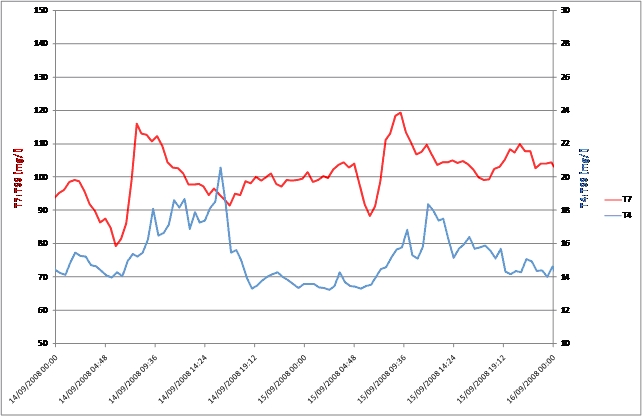
Figure 5: Daily tidal influence on total suspended sediment in channels (T7) and floodplains (T4)
The evaluation of the water level probes is just at the beginning. A first visualization of the automatically temperature and air pressure corrected OTT water level probes shows good and reasonable results, cf. Figure 6. The logged depths are in the range of the observed depths during the regular check of the stations. However, the onset of the inundation is not recorded because of a failure of the initially installed battery. It was replaced on the 23rd of August, where the recorded time series shown in Figure 6 starts.
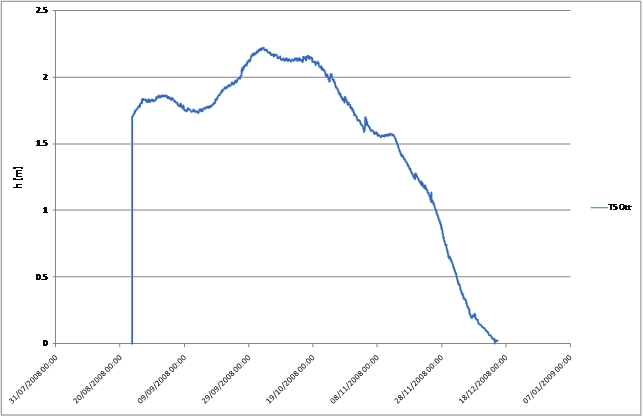
Figure 6: Relative water levels above probe logged at station T5 by the OTT system