Vietnam, Mekong Delta – Distribution of Students, 2006
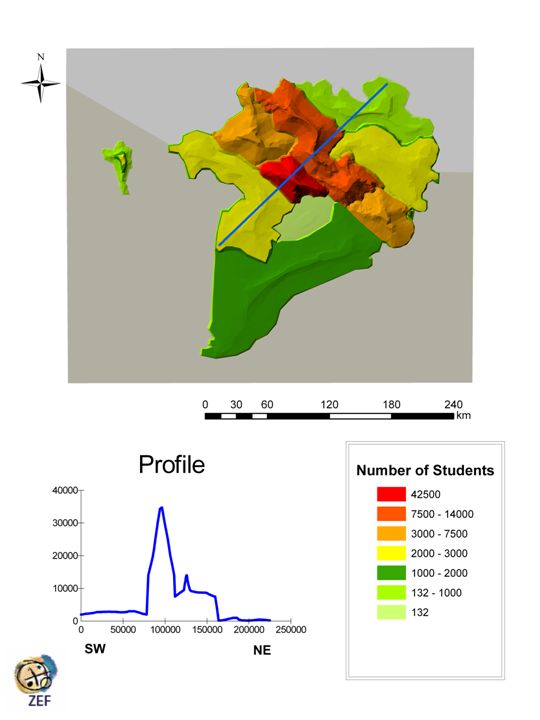
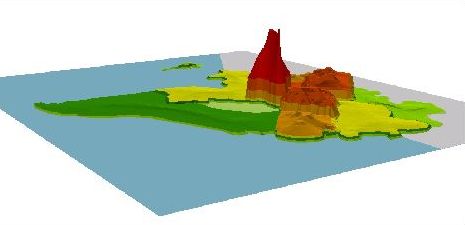
As an example for knowledge dispersion and epistemic landscapes the map illustrates the distribution of students in the Mekong Delta at the provincial level. The map is three-dimensional and includes a profile view from NE to SW. This perspective is also shown in the scene presented below.
As an example for knowledge dispersion and epistemic landscapes the map illustrates the distribution of students in the Mekong Delta at the provincial level. The map is three-dimensional and includes a profile view from NE to SW. This perspective is also shown in the scene presented below.

Figure 1: Vietnam, Mekong Delta – Distribution of Students, 2006. Scale: 1:3.000.000
The legend of the map categorizes the quantity of the students’ distribution in absolute values. The most important map attributes such as class values and the geographical scale are tabulated.
The completed map is based on a data set of 2006 provided by the General Statistical Office of Vietnam (www.gso.gov.vn).
Method: The classification in categories was fulfilled manually. The lowest and the highest category contain a single value each. All other categories stand for ranges of values. If 2 provinces fell into the same category, the provincial boundaries were removed and the provinces merged. Therefore we get an abstract map of the Mekong Delta, with a three dimensional shape illustrating the "peaks" & "hubs" of knowledge distribution. The height values of the 3D-shape correlate with the number of students. The interpolation within the single categories was randomly chosen and focussed on the comparison of maximum and minimum values at the provincial level. Finally the outcome shows that Can Tho City has by far the highest number of students. GIS: Reference coordination system: Projection UTM 48 N; Datum WGS 84

Figure 2: View from South-East: Mekong Delta – Distribution of Students, 2006.


