![]()
![]()

Hydrology of the Mekong Basin
First statistical analysis of discharge data sets longer than 80 years from major stations along the Mekong river showed a decreasing trend both in the magnitude of flood and low flow events, i.e. the mean annual peak discharges are decreasing, whereas the low flow periods tend to yield higher discharges. These linear trends are shown for the annual maximum discharges in Figure 1.
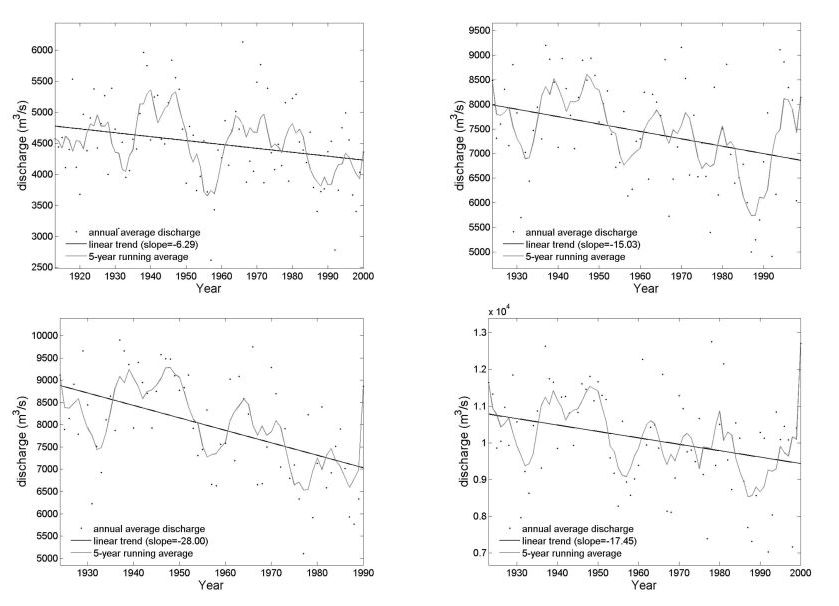
Figure 1 - Significant negative tendencies in annual average discharge in four stations in the Mekong basin. Clockwise starting from upper left corner: Vientiane, Thakhek, Mukdahan and Pakse.
However, in order to detect the variability of occurrences of extreme events and in order to take the non-stationarity of the time series into account, an extreme value statistics using a non-stationary Generalized Extreme Value (GEV) distribution. It was applied on two different variables: annual maximum flow (location and shape parameter as covariates) and annual maximum flow deficit under a 20 percentile threshold (only location parameter as a covariate). For the annual maximum flow the results are conclusive: all the stations present a negative trend for the location parameter (a decrease in the average floods, thus corroborate the linear trend analysis) and a positive trend on the scale parameter in Thakhek, Pakse and Kratie (an increase in variability). To illustrate, the probability density function (pdf) of annual maximum flow in Pakse is plotted in Figure 3 following the two different models for the year 2003.
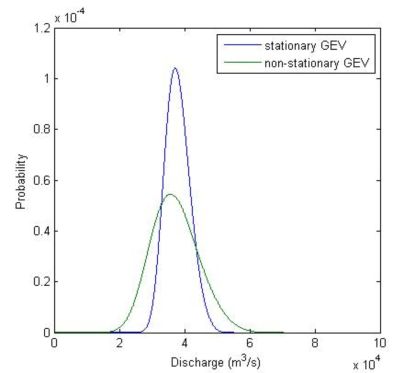
Figure 2 – Two probability density functions corresponding to the application of the non-stationary GEV model and the stationary GEV model to annual maximum flows at Pakse. The non-stationary case has two covariates: location and scale parameter.
The pdf of the non-stationary GEV is shallower than the other and the probability of a flood of more than 50000 m3/s is greater for this case, although the location parameter suffered a decrease. This means that on average, the floods are decreasing, although the variability is increasing. A year with a very high flood followed by one with a very low flood season is more likely than before. For low flows, only the location parameter was used as a covariate, yielding significant negative trends on the cumulative flow deficit, which means that on average low flow periods are declining, i.e. discharge in dry periods tend to increase. This also corresponds to the linear trend analysis.